

In many respects, credit option strategies resemble those used in other asset classes. For example, we can express views on the direction of credit spreads or on anticipated changes in implied volatility.
If you need a quick refresh on credit option payoff diagrams here is a link to part 2.
Credit option strategies – hedging an underlying exposure
Here we consider a strategy to hedge an underlying exposure. I have attached an image which we can walk through to explain the process. The three payoff diagrams show profits or losses on the Y axis and the underlying spread on the X axis.
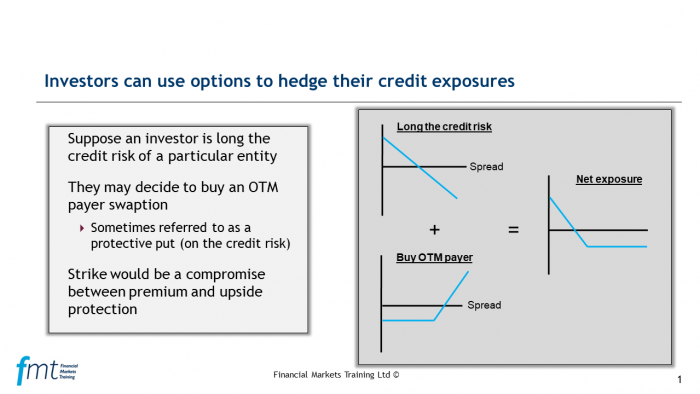
The upper left hand image illustrates an investor’s credit risk exposure from some asset. The investor may have purchased a single asset or a portfolio of assets. Notice the profit and loss line goes from top left to bottom right. If the credit spread declines the long position will show a profit. We can combine this with a long payer option, struck OTM as a form of disaster insurance. This gives the purchaser the right to buy CDS protection if exercised.
We illustrate the net exposure on the right hand panel. If the credit risk improves (i.e. the spread falls) the option lapses and the investor benefits. If the underlying credit risk declines (i.e. the spread increases), the investor exercises the option to mitigate the losses.
The strategy is popular in the equity market. In that context, an investor buys a share and an OTM put option. We term this strategy a ‘protective put’ but using the same phrase for credit options might prove confusing as the profile of a long payer resembles a call.
Credit option strategies – yield enhancement
In the world of equity options, the concept of a covered call is well established. Here an investor buys an equity and sells an out of the money option. The investor sets the option strike above the current share price to minimise the likelihood of exercise. The strategy will work if the underlying price does not display too much volatility and so the option is not exercised allowing the investor to retain the option premium.
The idea does also transfer to the credit market, and we illustrate this on the attached slide. Each of the diagrams shows a profit and loss profile (Y axis) against the underlying price (credit spreads; X-axis). In the top left hand corner, the investor is long the credit risk of some underlying asset (or portfolio of assets). The position will show a profit if credit spreads fall.
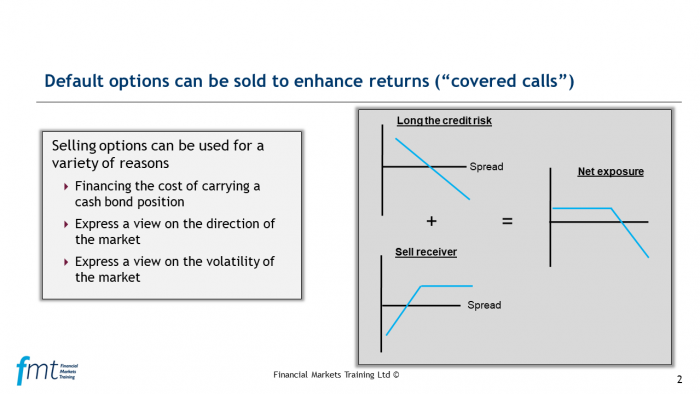
The bottom left hand panel illustrates the sale of a receiver swaption. The sale of the option will require the investor to receive fixed in a CDS if exercised. In other words, they will become a seller of protection. The option buyer only exercises the option if par spreads fall. The option will be OTM if the strike of the option is lower than the current par spread.
The right hand panel illustrates the net exposure. The investor makes money if spreads fall, but if the fall was significant, the exercise of the option will not allow the investor to benefit further.